EURUSD Trade Recap – ICT Smart Money Concepts Short Setup | May 29, 2025
Learn how I executed a high-probability EURUSD short using the ICT Smart Money Concepts New York Continuation model on May 29, 2025. Full trade breakdown, market structure analysis, and key lessons included.
TRADE RECAPS
Charts Decoded
📈 EURUSD ICT NY Continuation Model Trade Recap – May 29, 2025
Session: New York
Model: ICT New York Continuation
Pair: EUR/USD
Date: Thursday, May 29, 2025
📊 Market Context
Before the London and New York sessions, during Asia, EUR/USD experienced an aggressive bearish move. While many attributed this to the U.S. court ruling on Trump’s case, the chart told its own story.
EUR/USD was tapping into a weekly/daily imbalance left behind weeks prior.
DXY (Dollar Index) was pushing into a weekly gap, seeking liquidity.
From a higher time frame perspective, we saw:
DXY in a longer-term bearish structure.
EUR/USD showing signs of a bullish continuation.
This helped us contextualize the bearish move in Asia as a liquidity grab—a stop hunt that aligns with the higher timeframe bullish narrative.
📍 London Session Observations
In London, we observed key technical behaviors that reinforced the bullish bias:
EUR/USD filled a 15-minute volume imbalance, then closed above it.
This suggested the imbalance had shifted to acting as support.
Similarly, DXY showed weakness and rejection off its gap area.
The price action confirmed the likelihood of a NY Continuation Model, where we expect:
Minimal retracements in London Session.
Expansion higher during NY session after a minor pullback.
✅ New York Entry Setup
In NY, our entry strategy was based on these key confluences:
🔹 Higher Timeframe Structure:
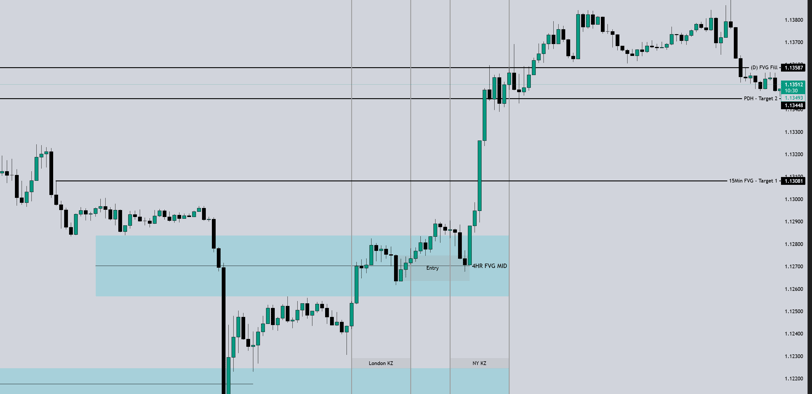
On the 4H chart, price had closed above a 4H volume imbalance midpoint and showed signs of support.
🔹 1H Confluence:
Price dipped into a 1H FVG and then closed above it.
This also aligned with the midpoint of the 4H imbalance = dual confluence.
🔹 15-Minute Confirmation:
Price showed a break in market structure.
Retracement into a 15M bullish order block, overlapping with:
4H imbalance midpoint
1H FVG zone
This area marked our entry point in the New York Kill Zone.
🎯 Profit Targets
TP1: A nearby 15-minute FVG
TP2 (Extended): Previous day’s high, aligning with clean liquidity above.
News dropped at 7:30 AM EST, causing a bullish expansion, confirming the continuation model.
🧠 Key Lesson: Market Structure Still Rules
This trade highlighted the importance of market structure and multi-timeframe confluence:
A bearish move doesn’t always mean a reversal—it can be a liquidity sweep.
Waiting for clear structure confirmation, like the 4H candle closures, helped avoid early or emotional entries.
Understanding the NY Continuation Model means knowing when not to expect deep retracements.
“Price doesn’t move randomly. It seeks liquidity. Your job is to find out where it’s hiding.” — ICT Principles
📚 Learn More About the Model Used
Want to understand the strategy behind this trade?
👉 Click here to learn about the ICT New York Continuation Model
📢 Want More Trade Breakdowns Like This?
If you enjoy these detailed recaps and want to learn more about ICT concepts in real-time charts:
Subscribe to our newsletter
👉 Click here — Charts powered by Tradingview
👉 Subscribe to our newsletter get all future recaps and exclusive trading insights – for free.
Subscribe to our newsletter
Enjoy exclusive special deals available only to our subscribers.